Image Degradation and Sharpening in the Visual System
Robert M. Springer, James R. Hamerly, Brian C. Madden and Charles A. Dvorak
ARVO 1979
abstract
Several papers over the last few years have suggested that the visual system compensates for the degradation of the stimulus image by the visual optics. At last year’s ARVO session Springer and Hamerly, using results of sinewave contrast perception experiments, argued that such a compensation, if it occurs at all, cannot be due to a linear amplification of the retinal image as some have hypothesized. However, new evidence gathered suggested that compensation does occur.
Squarewave gratings of 1 and 6 cpd and at .20 and .80 contrast, corrected for optical degradation using the Optical Transfer Function (OTF) reported by van Meeteren (1974), were used to produce hypothetically perfect retinal images. While the .20 contrast images appeared somewhat overly compensated, the .80 contrast images appeared to be extremely overcompensated, exhibiting marked bands near the edge boundaries. Further data indicate that only 12% of the theoretically necessary correction is needed to produce squarewave appearing images. Either the published OTF data are grossly incorrect or unknown mechanisms are involved.
We undertook a series of psychophysical experiments to test the effects of visual optics and other scattering mechanisms on high-contrast stimuli. Small spot (7’) increment thresholds were measured at .063° to 4° from three 4400 Troland rectangular stimuli with varying physical dimensions. The results suggest that, if anything, published data on optical degradation and light scattering are conservative and that some type of neural enhancement must be occurring.
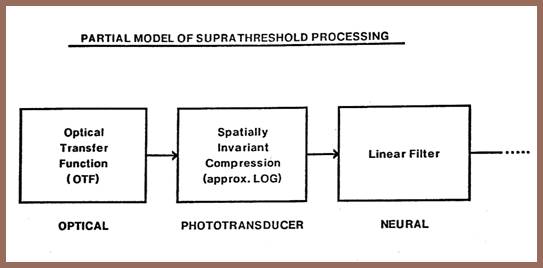
This slide shows the first three stages of visual processing as they are generally held to occur at suprathreshold contrast levels. Until this study, we too supported this model although we had further separated the linear filter into several substages and had argued for an additional induction stage which followed the dotted line.
In this paper, I would like to tell you why we no longer believe that even this rudimentary suprathreshold model is valid.
In order to understand better the stages involved in suprathreshold processing, we attempted to create a stimulus of specified appearance. By compensating for each stage of suprathreshold processing as we understood it, we attempted to construct a perfectly square appearing squarewave grating.
I would like to begin by showing you how physical (uncompensated) squarewave gratings appear to typical observers.
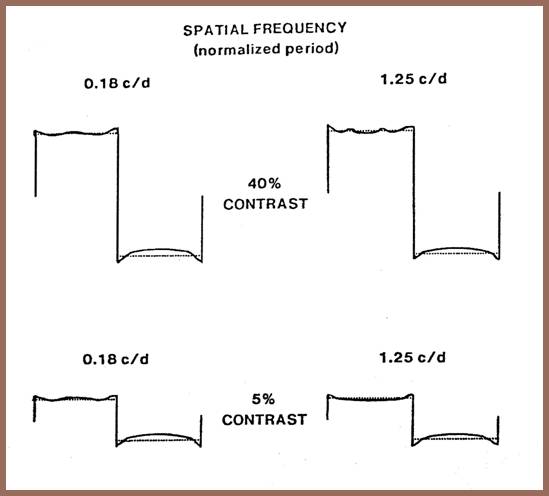
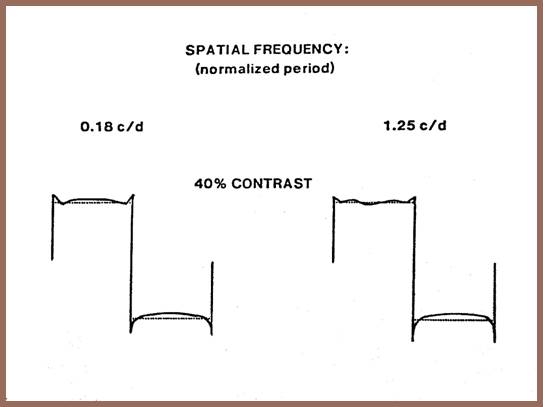
Three of us trained for several hundred hours to make sketches of stimulus appearance. We scaled each stimulus appearance profile on a white-black scale – white is up – black down. In the upper left, for example, is shown the appearance profile of one cycle of one of the physical squarewaves we evaluated. Here we have drawn the appearance of the lighter bar, here the darker bar. According to these data, the appearance of the dark bar is concave, that is, lighter or whiter in the middle than on the sides. Note that each drawing was made over the dotted profile of a true squarewave as a guide. Composite appearance profiles were constructed by averaging the separate profiles from each observer. Here we rated the appearance of four physical squarewaves – two at 40% contrast and two at 55% contrast. All squarewaves are shown normalized to one period so that they can be directly compared.
These data tell us that physical squarewaves do not appear square. There is a cusping which as often been ascribed to a low frequency loss which is particularly prominent in the darker field. That the cusping is so asymmetrical has been taken as evidence of an approximately logarithmic compression. Finally, we thought that the bands near the edges might arise from an interplay between optical degradation and neural processing.
Initially, we asked what would happen if we compensated a squarewave grating for the loss through the optical system. That is, how would a squarewave on the retina appear? We expected such stimuli to be squarer than any we had ever seen; unfortunately, that did not turn out to be the case.
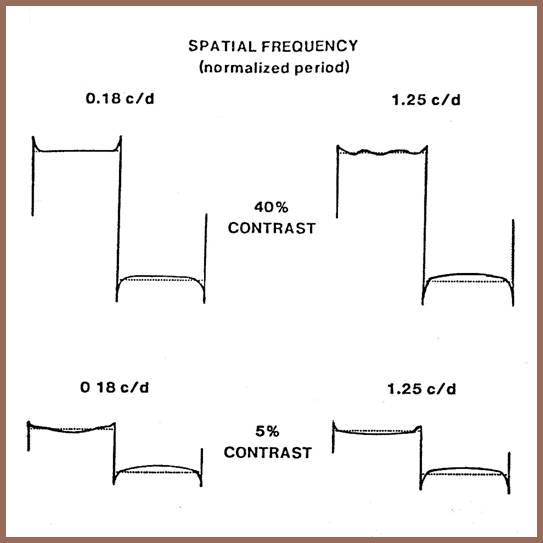
The next slide shows our scaling of four squarewaves corrected for optical loss as described by Campbell and Green (1965). Each observer saw thin prominent bands near the edges of the gratings, the darker bands being particularly visible.
We concluded that either the Optical Transfer Function (OTF) we were using was incorrect and we had overcorrected the stimulus or that the visual system sees a physical squarewave as square as it can and therefore that a retinal squarewave is seen as overcorrected.
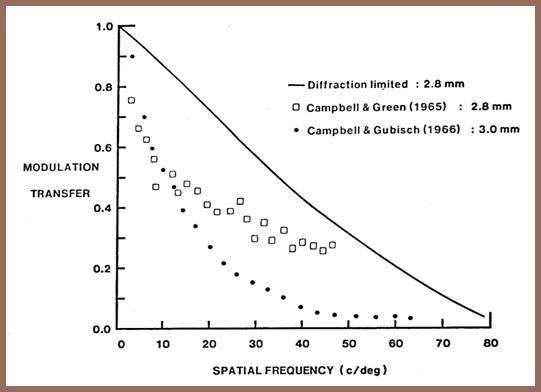
We made an extensive review of the visual optics literature. The next slide shows the range of OTFs that we found. The upper data (squares) are those of Campbell and Green obtained using an interference technique. The lower data (dots) are those of Campbell and Gubisch for as close a matching pupil as available. The Campbell-Gubisch data are typical of reflection densitometry results. A you can see, the Campbell-Green results were the least attenuating of those found in the literature. A study we performed of scatter in the visual system using an increment threshold technique indicated that the Campbell and Green data, at least to 10c/d, are perhaps even optimistic. As a definitive check, we were interested to know whether bands would be visible if we assumed the eye to be perfect, that is, diffraction limited – the OTF is shown by the solid line.
The next slide shows the appearance of two squarewaves corrected for a diffraction-limited eye assuming a pupil of 2.8 mm. While the dark bands are narrower than in the lest slide, they are clearly visible.
We must conclude that the apparent overcorrection we observed did not arise from underestimating the quality of the visual optics. I wish to thank Gerald Westheimer for his assistance in arriving at this conclusion.
Bands were, in fact, visible for our 40% stimuli when only about 10% of the Campbell-Green correction was introduced. These data tell us that the eye sees the edges of physical squarewaves as essentially square and that any attempt to correct for optical degradation produces an apparent overcorrection.
The strong asymmetry of the edge bands perceived for retinal squarewaves has marked importance for a model of suprathreshold processing. This asymmetry suggests that either 1) the correction for optical degradation is not the result of a linear boosting of high frequencies (as Georgeson and Sullivan maintain), or 2) the correction is a linear boost, but the spatially invariant compression (the approximate logarithmic compression) or an additional nonlinear process occurs after such a stage, or 3) the spatially invariant compression is not spatially invariant. A summary of our findings on the corrective capability of the visual system can be obtained from the next slide.

While not understanding the mechanism leading to the overcompensated appearance of retinal squarewaves, we persisted in our goal to create a squared squarewave. We next attempted to correct squarewaves for the apparent low frequency loss they exhibit – the cusping described earlier.
By properly boosting low frequencies and compensating for the hypothesized log compression, it was possible to remove the cusping at the two contrasts and frequencies we tested. No correction for optical loss was made. The next slide shows our observations as we passed through this point of optimal correction. You can see that we can very close to creating a square-appearing squarewave. Note, however, that even with no correction for high frequency loss, we continued to see faint edge bands (now, however, they are symmetrical). I thought you might find the luminance profile of our nearly perfect appearing squarewave interesting.
Interestingly, we found that the amount of absolute low frequency correction necessary to remove cusping is almost unchanged as a function of contrast. This suggests that we are simply restoring energy subtracted out in the process of suppressing threshold. We speculated that if the low frequency loss were truly subtractive, the amount of cusping in a physical squarewave should be approximately equal regardless of contrast.
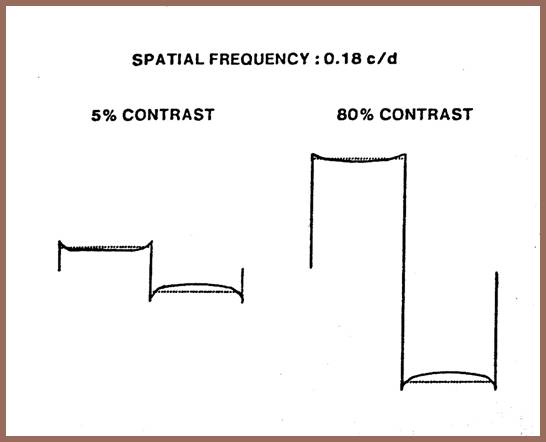
As shown in the next slide, the concavities in the dark fields are, in fact, almost equivalent even though the two stimuli differ by a factor of 16 in contrast.
There is, unfortunately, a problem with assuming a simple subtractive process. It is apparent that the low frequency loss is quite asymmetrical leading to the conclusion that either the loss does not, in fact, result from a simple subtractive process or that the log or additional nonlinear stage occurs after the low frequency attenuation.
As a summary of this research, I would like to show you again the model I began with and remind you of two facts. First, the fact that the retinal squarewaves appear markedly overcompensated suggests that this model is missing an important stage of which we have, as yet, little understanding. A second fact, that of the persistent asymmetries found throughout our research, indicates that either the log stage belongs after the linear filter or that additional nonlinear mechanisms exist. Next year we hope to tell you more about the mechanisms from which these phenomena arise.