Spatial Acuity Model
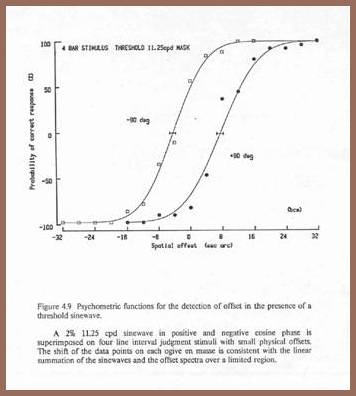
The most satisfying and elegant (imho) result in my thesis was that the superposition of a threshold sinewave with the appropriate (theory-predicted) spatial frequency and phase induced a perceived threshold shift in spatial position (Figure 4.9) while other grating configurations had no effect. In addition, apart from the reconciliation of the major metrics of acuity and accounting for the many stimulus interactions, the thesis data contain a wealth of opportunities that should be developed further.
The relation between bar separation and contrast on offset threshold with the four bar stimulus (Figure 3.20) shows a number of interactions. Spatial offset threshold decreases with increasing contrast in a relation that demonstrates an increase in threshold for both smaller and larger bar separations. This is consistent with multiple antagonistic spectral sign changes (regions of greatest change sensitivity) increasingly falling within the bandwidth of individual filters at large bar separations, and with the first spectral sign change shifting to higher spatial frequencies and filters with lower sensitivity at small bar separations. That an appreciable decrease in offset threshold at the widest bar separation (640 seconds of arc) with the contrast of clearly distinct and visible bars speaks to the impact of these interactions on crowding phenomena as well. Data were not collected for separations beyond this, but the contrast effect did not appear yet to be close to being extinguished. The cleanest indication of the influence of contrast on offset threshold might be seen in the data at 160 seconds of arc where the combined effect of increasing and decreasing separations appears to be at a minimum.
Additional (largely unpublished) data shows details of the interaction of contrast and offset where the shift of the bar positions along the superimposed sinewaves result in undulations in the shape of the psychometric functions. When examined in detail, it is not altogether unexpected that the aggregate response of an array of bandpass filters to changes in the internal relative positions of a stimulus as complex as four bars be locally nonlinear. The question is can perceptual correlates be found?
Another investigation determined that an experienced subject was able to make judgments about a criterion stimulus with other than zero (symmetric) offsets. When the subject was shown a criterion stimulus for 20 seconds that possessed any of a range of both incremental and decremental offsets, the shape (steepness) of the subsequently obtained psychometric functions which characterized observer sensitivity to changes in position about the selected asymmetric criterion, was not altered. There is apparently nothing special about symmetric stimuli. Nor should there be when contrast detection and discrimination are the underlying mechanisms that act to enhance relative position judgments.
After more than 25 years, there is a good deal more that fresh eyes may uncover. The model will certainly get a good review during the development of the new visual response metric for the Diagnostic Imaging Chain Model that will incorporate both luminance and chromatic contrast. Nonetheless, despite the decade-long decrease of the term hyperacuity in the Google n-gram data, I have to say that (again, imho) there still is a good deal of play left in what hyperacuity research has to provide spatial vision. There is still need to secure general acceptance of the relation among absolute positional labeling, contrast sensitivity and relative positional sensitivity. This effort will not only provide the warp and weft of spatial vision will also go a long way toward defining how objects are constructed and segmented in vision.